Interpolation
Please Log In for full access to the web site.
Note that this link will take you to an external site (https://shimmer.mit.edu) to authenticate, and then you will be redirected back to this page.
Error on line 4 of Python tag (line 5 of source):
    from PIL import Image

ModuleNotFoundError: No module named 'PIL'
Table of Contents
We spent a fair amount of time this semester thinking about sampling (converting a CT signal into a DT signal). In this problem, we'll explore a couple of different methods of interpolation, which we'll use to approximate an underlying CT signal from a given set of DT samples.
One method for approximating the underlying continuous waveform is called zero-order hold (ZOH), which is illustrated in the following plot.


In this scheme, we use samples separated by T=1/sample_rate (left
figure) to create a function of continuous time (right figure) by
assigning the sample value to all times t in the interval
nT\le t\lt(n\!+\!1)\,T.
The advantage of this scheme is that it is easy to program (and easy
to implement in hardware).
Write a function zoh(samples, sample_rate) that takes as arguments a list of
samples and a sampling rate (Hz) that characterize x[n]. zoh should return
a function. The returned function should take an arbitrary value of time t
(in seconds) as input, and it should return the value of x_h(t) at that time
t. You may assume that the first sample (n=0) corresponds to t=0
seconds, and you only need to worry about values of t that fall in the range
associated with the given samples.
Enter your function in the box below and check that it works properly.
Error on line 15 of question tag.
    csq_tests.append({'code': 'func = zoh(%r, %d)\nans = func(%f)' % (samples, sr, t), 'check_function': checknum})

NameError: name 'checknum' is not defined
It is often the case that the method described above does not produce a particularly good approximation of the underlying CT function. We can do better by using a better interpolator (i.e., to change the way we estimate the underlying continuous waveform from the discrete samples we are given). A good choioce is linear interpolation (sometimes referred to as a first-order hold), which is described by the figures below.

Write a function linear(samples, sample_rate) that returns the value of
x_l(t) for an arbitary time t.
Enter you function in the box below to check that it works properly.
Error on line 21 of question tag.
    csq_tests.append({'code': 'x_l = linear(%r, %d)\nans = x_l(%f)' % (samples, sr, t), 'check_function': checknum})

NameError: name 'checknum' is not defined
One neat thing we can do with the interpolators from above is to use them to generate resampled versions of a signal. We can do this by first approximating the underlying continuous function using one of the methods above, and then re-sampling that continuous function at a different sampling rate.
In general, if we are given N_1 samples of a DT signal sampled at sampling rate f_{s1} samples per second, then we can consider the underlying CT signal to have a length of N_1/f_{s1}. When we resample this CT function to generate a sequence of length N_2, we should sample every f_{s2} = (N_2/N_1)f_{s1} seconds.
In fact, we can apply the same idea in 2-D as well. An interesting way to implement these 2D interpolators is as repeated applications of a 1D interpolator. First apply a 1D interpolator to all of the rows of the image and stack these results together to get an image with width W_o and height H_i. Then apply the same 1D interpolator to all of the columns to get the final image.
Write a function called zoh1D to do a 1D interpolation using a zero-order
hold. The inputs to zoh1D should be
sequence– which is a list of values,new_length– which is an integer specifying the length of the desired output
and the output should be a new list of values.
If it is helpful, you may assume that your zoh function from above is defined
for you in the box below:
Error on line 39 of question tag.
    i['check_function'] = check_list

NameError: name 'check_list' is not defined
Next write a function called zoh2D to do a 2D interpolation
using the zero-order hold.
The inputs to zoh2D should be
array– which is an array (list of lists) of values organized as a list of rows,new_width– which is an integer specifying the width of the desired output, andnew_height– which is an integer specifying the height of the desired output
and the output should be a new list of lists (as opposed to a numpy array).
In this code box, zoh1D has been defined for you, so you may use it in your
implementation of zoh2D.
Error on line 31 of question tag.
    'transform_output': block},

NameError: name 'block' is not defined
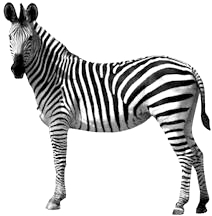
We have provided a test image called zebra.png
here.
Use your zoh2D program to create three new images and upload them below.
Note that you can use arr.tolist() to convert a numpy array to a
list-of-lists, and you can use numpy.array(lis) to convert a list-of-lists
into a numpy array.
z_tall.pngwith width of 100 and height of 500,z_short.pngwith width of 500 and height of 100,z_zoom.pngwith width of 500 and height of 500.
z_tall.png:

z_short.png:
z_zoom.png:
Write a function called linear1D to do a 1D interpolation
using linear interpolation.
The inputs to linear1D should be
sequence– which is a list of values,new_length– which is an integer specifying the length of the desired output
and the output should be a new list of values.
You may assume that your linear function from above is defined for you.
Error on line 24 of question tag.
    {'code': 'ans = linear1D([0,1,0], 3)', 'check_function': check_list},

NameError: name 'check_list' is not defined
Next write a function called bilinear2D to do a 2D interpolation
using biliear interpolation.
The inputs to bilinear2D should be
array– which is an array of values organized as a list of rows,new_width– which is an integer specifying the width of the desired output, andnew_height– which is an integer specifying the height of the desired output
and the output should be a new list-of-lists, organized as a list of rows.
In this code box, linear1D has been defined for you, so you may use it in
your implementation of bilinear2D.
Error on line 34 of question tag.
    'transform_output': block_pretty, 'check_function': check_2D_list},

NameError: name 'block_pretty' is not defined
Use your bilinear2D program to create three new images based on zebra.png
and upload them below:
l_tall.pngwith width of 100 and height of 500,l_short.pngwith width of 500 and height of 100,l_zoom.pngwith width of 500 and height of 500.
l_tall.png:
l_short.png:
l_zoom.png: