More Peaks and Valleys
Please Log In for full access to the web site.
Note that this link will take you to an external site (https://shimmer.mit.edu) to authenticate, and then you will be redirected back to this page.
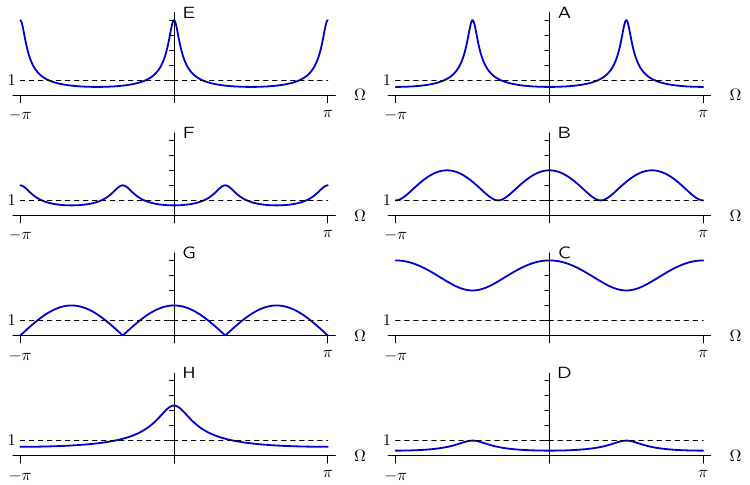
Each of the plots below shows the magnitude of the frequency response of discrete-time system that can be described by one of the following difference equations, where \alpha and m are parameters.
Form A: y[n]=x[n]+\alpha x[n{-}m]
Form B: y[n]=x[n]+\alpha y[n{-}m]
Each row in the following table gives the parameters for one of the plots.
Write the letter of the corresponding plot in the right column of the table.

Note that the dashed line marks where the magnitude would be equal to 1.
Please upload a single pdf file that contains your answers to all parts of this problem: No file selected
