Find the Phase in 2D
Please Log In for full access to the web site.
Note that this link will take you to an external site (https://shimmer.mit.edu) to authenticate, and then you will be redirected back to this page.
Panels 1-8 illustrate eight 2D discrete-time signals. Each signal has 11 rows and 11 columns. Black represents -1, grey represents 0 and white represents 1. The origin of each of these panels is in the center of the panel, r increases downward, and c increases to the right.
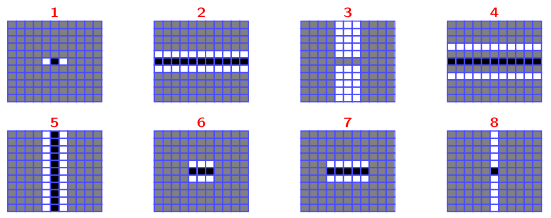
For each signal, determine which of the following panels represents the angle of the (11\times11) DFT of that signal, where black represents 0, white represents \pi, and gray represents samples for which the angle is indeterminate (because the corresponding magnitude is 0). The origin of each of these panels is in the center of the panel, k_r increases downward, and k_c increases to the right.
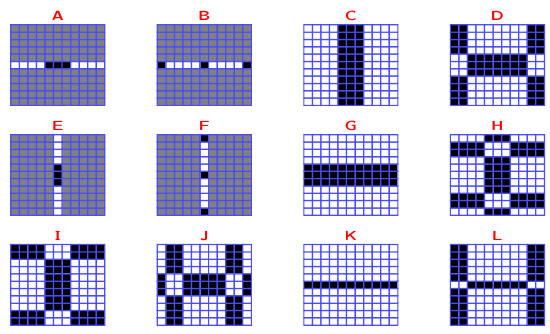
Which angle plot matches with each signal?
