Discrete Fourier Transform Matching
Please Log In for full access to the web site.
Note that this link will take you to an external site (https://shimmer.mit.edu) to authenticate, and then you will be redirected back to this page.
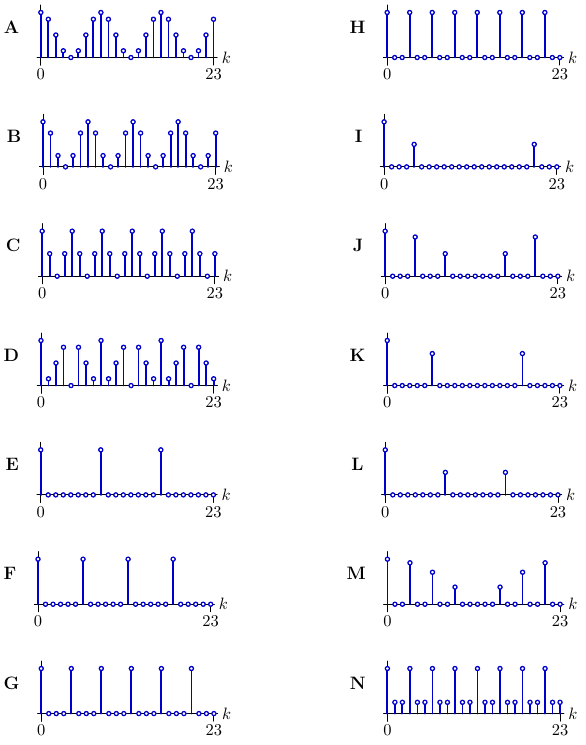
Each of the seven plots below shows the first 24 samples of a discrete-time signal.
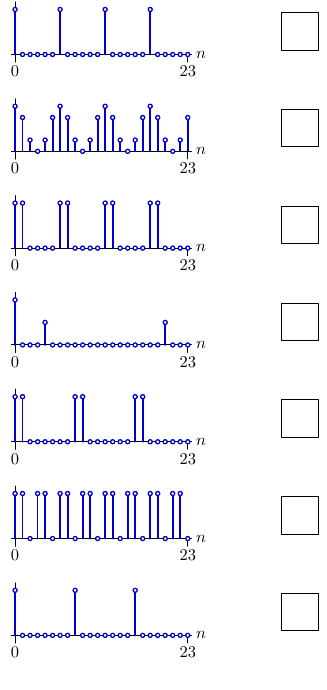
Determine which of the fourteen plots below corresponds to the magnitude of the 24-point Discrete Fourier Transform (DFT) for each of the previous signals, and enter the letter of the plot (A-N) in the box provided (above).
Note that the vertical scale for each plot is different: it has been normalized so that the peak value in each plot is 1.
Please upload a single pdf file that contains your answers to all parts of this problem: No file selected
