Phase Matching
Please Log In for full access to the web site.
Note that this link will take you to an external site (https://shimmer.mit.edu) to authenticate, and then you will be redirected back to this page.
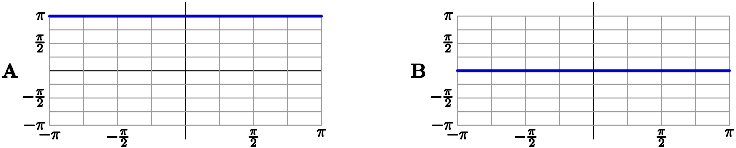
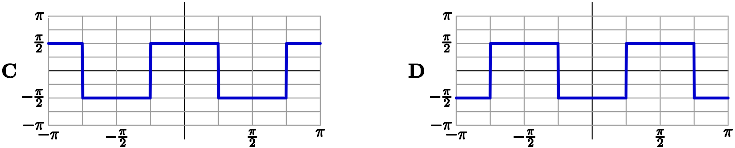
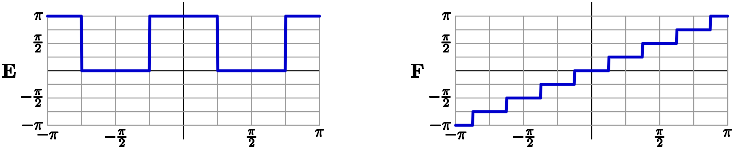
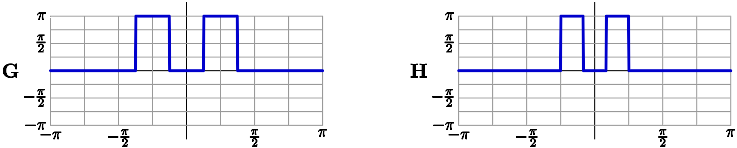
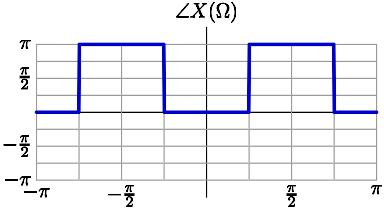
Below, we plot the angles of the DTFT of some signal x[\cdot]. The following plot shows \angle X(\Omega) as a function of \Omega, for -\pi < \Omega < \pi:
For each of the following signals, indicate which of the plots below, if any,
is the plot of the angles of that signal's DTFT. If none of the graphs matches, select none instead. If there is not enough information to determine the answer, choose NEI (for "Not Enough Information") instead.

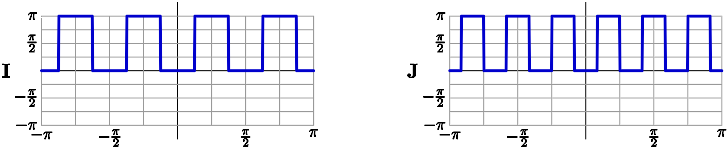
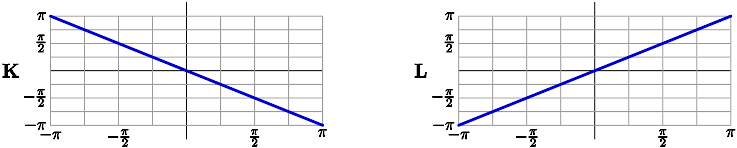
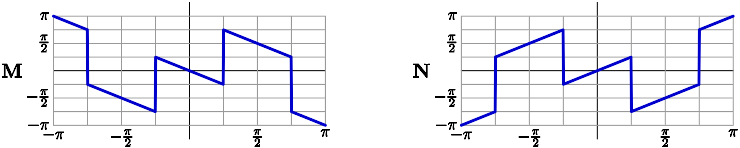
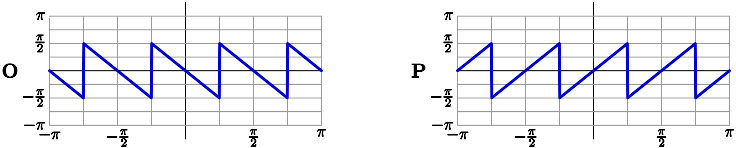
Graphs for Matching: