DFTs of Note
Please Log In for full access to the web site.
Note that this link will take you to an external site (https://shimmer.mit.edu) to authenticate, and then you will be redirected back to this page.
In this problem, we will consider a CT signal consisting of two distinct notes, one an "C" at 523Hz, and another an "A" at 1760Hz, each represented by a pure cosine.
Imagine sampling this signal at a rate f_s = 2000 samples per second to produce a DT signal, and then computing the DFT of that signal with some value N, where N is a power of 2. Plotting the DFT magnitudes gives us the following graph for some range of k values (not necessarily the whole range of k values). Note also that we have plotted this as a line graph for clarity even though X[k] is actually a function of discrete k):
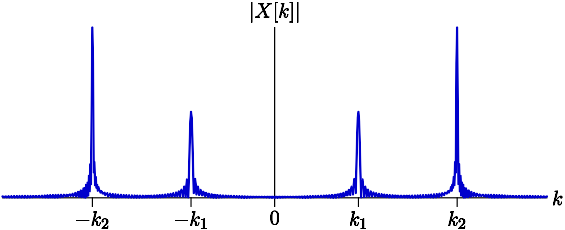
Under this analysis, the "C" note (523Hz) corresponds to peaks centered at k=\pm 268. Given this information, answer the following questions:
N=~

Enter your answer as a Python expression (not necessarily simplified); and note that you can use Python's round function to round to the nearest integer; you do not need to calculate the exact result by hand.